Performance on a phone
What actually costs time when Clojure draws through raylib on an iPhone, in the order the measurements arrived rather than the order that makes us look clever. Every number here was read off a device, an iPhone 17 Pro on iOS 26.6.1, over the app's own nREPL while it was running.
The headline, because it inverts the obvious guess: the FFI is not the bottleneck, and the sequence machinery is.
The obvious guess, and why it was wrong
Every draw call crosses libffi. On portable bytecode there is no JIT, and the notebooks this project grew from clocked the interpreter at roughly 45x native on arithmetic. So the natural model is "count your draw calls, that is your budget", and the natural fix is to draw less.
Five scenes were ported in an afternoon and measured. Two were slow:
| scene | per frame | fps |
|---|---|---|
| fireworks | ~120 circles | 58 |
| hilbert | 1023 lines, colours precomputed | 60 |
| tree | 511 branches, rebuilt each frame for the sway | 59 |
| stars | 220 circles | 58 |
| l-system | 1488 static segments, one colour | 59 |
| flow-field | 90 particles, ~630 segments | 54 |
The last two rows together make the point better than the prose does. The L-system draws 1488 segments at 59 fps; the flow field draws roughly 630 and managed 32. Segment count is not the variable. What separates them is that the L-system's geometry is a vector computed once and its colour is a constant, while the flow field steps 130 particles through trigonometry and rebuilds a trail vector for each, every frame.
Tuning it took two rounds of the same lesson. The draw loop recomputed each particle's field angle for its colour when the step had just computed it; carrying the angle on the particle took it from 32 fps to 39. The rest was the stepping itself, so the count came down: measured by re-entering the scene at each setting, 130 gives 39, 90 gives 54 and 60 gives 59.
Hilbert is the one worth staring at. It draws MORE lines than spirograph and runs faster, 1023 at 60 against roughly 1000 at 55, because its curve and its per-segment colours are computed once at init and the draw loop does nothing but read two vectors. The original recomputes each segment's colour inline from three sin calls, which is 3069 transcendentals a frame for a picture that never changes.
Three more scenes, from the next round of measuring, break the model the other way:
| scene | per frame | fps |
|---|---|---|
| penrose | ~2400 FFI calls: 1360 rlgl, 1020 lines | 59 |
| spirograph | ~1800 lines | 18 |
| kaleidoscope | ~1788 lines | 15 |
Penrose makes more FFI calls than spirograph and runs three times faster. That kills the model outright. Whatever is costing time, it is not the calls.
What it actually was
The difference is what the drawing loop does around each call.
Penrose iterates a plain vector and computes its edge colour once, outside the loop. Spirograph did this:
(doseq [[i [[x1 y1] [x2 y2]]] (map-indexed vector (partition 2 1 points))]
  (rl/draw-line (int x1) (int y1) (int x2) (int y2) (color (spiro/rainbow i))))
which per frame builds a lazy sequence of 1800 pairs, wraps each in an index tuple, destructures four levels deep, and allocates a colour vector. Rewritten as an indexed loop over the same vector, drawing exactly the same lines through exactly the same FFI:
(let [n (count points)]
  (loop [i 1]
    (when (< i n)
      (let [a (nth points (dec i)) b (nth points i)
            [r g b' a'] (spiro/rainbow i)]
        (rl/draw-line (int (nth a 0)) (int (nth a 1)) (int (nth b 0)) (int (nth b 1))
                      (rl/rgba r g b' a')))
      (recur (inc i)))))
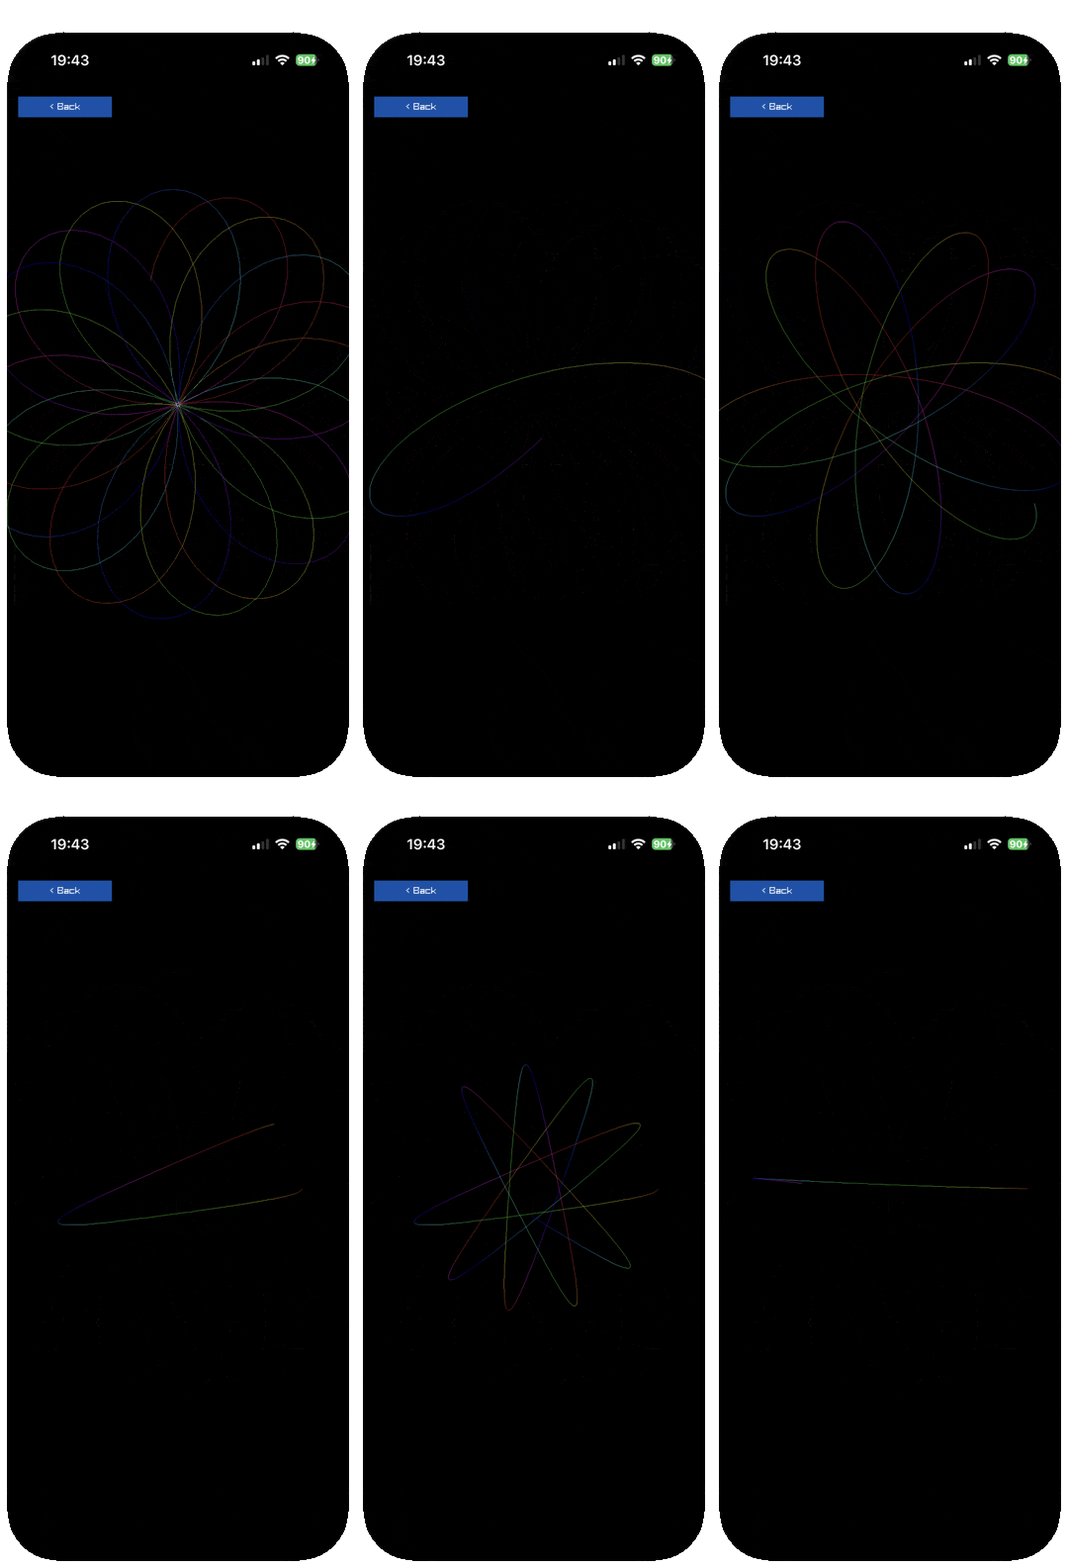
Spirograph after the loop was rewritten: the curve draws itself at 55 fps where the lazy-sequence version managed 14 at the same point count.
| spirograph, points | 1008 | 1288 | 1552 | 1768 |
|---|---|---|---|---|
| lazy sequence | 14 | - | - | - |
| indexed loop | 52 | 40 | 37 | 32 |
3.5x, with the same number of draw calls.
Kaleidoscope had the same disease one layer down. Its pure namespace returned a lazy sequence of ready-made segment tuples, 1788 of them, and its helper returned [x y], so two vectors were allocated per line. Handing the host a dozen rotation triples and letting it loop by index, with the arithmetic inlined and nothing allocated per line:
| kaleidoscope, 1068 lines | fps |
|---|---|
tuples from a for comprehension | 22 |
indexed loop, place returning [x y] | 22 |
| indexed loop, arithmetic inlined | 47 |
Note the middle row. Removing the lazy sequence alone changed nothing, because the per-line allocation was still there. Both had to go.
The rule this leaves
On this runtime, in a loop that runs hundreds of times per frame:
- An indexed
loop/recurover a vector beats any sequence function.partition,map-indexed,forand friends are fine once per frame and ruinous per element. - Allocation is the cost, not the call. A helper returning
[x y]is a vector per invocation. Inline the arithmetic on the hot path and leave the readable version beside it for the tests, which is whatkaleidoscope/placeis for. - Hoist anything constant out. Penrose was fast partly because its edge colour is computed once, not per line.
- The FFI is cheap. 2400 calls a frame held 59 fps. Do not contort a design to avoid draw calls until you have measured that they are the problem.
None of this is exotic Clojure advice. What is different is the magnitude: on a JIT these habits cost a few percent, and here they cost three to four times.
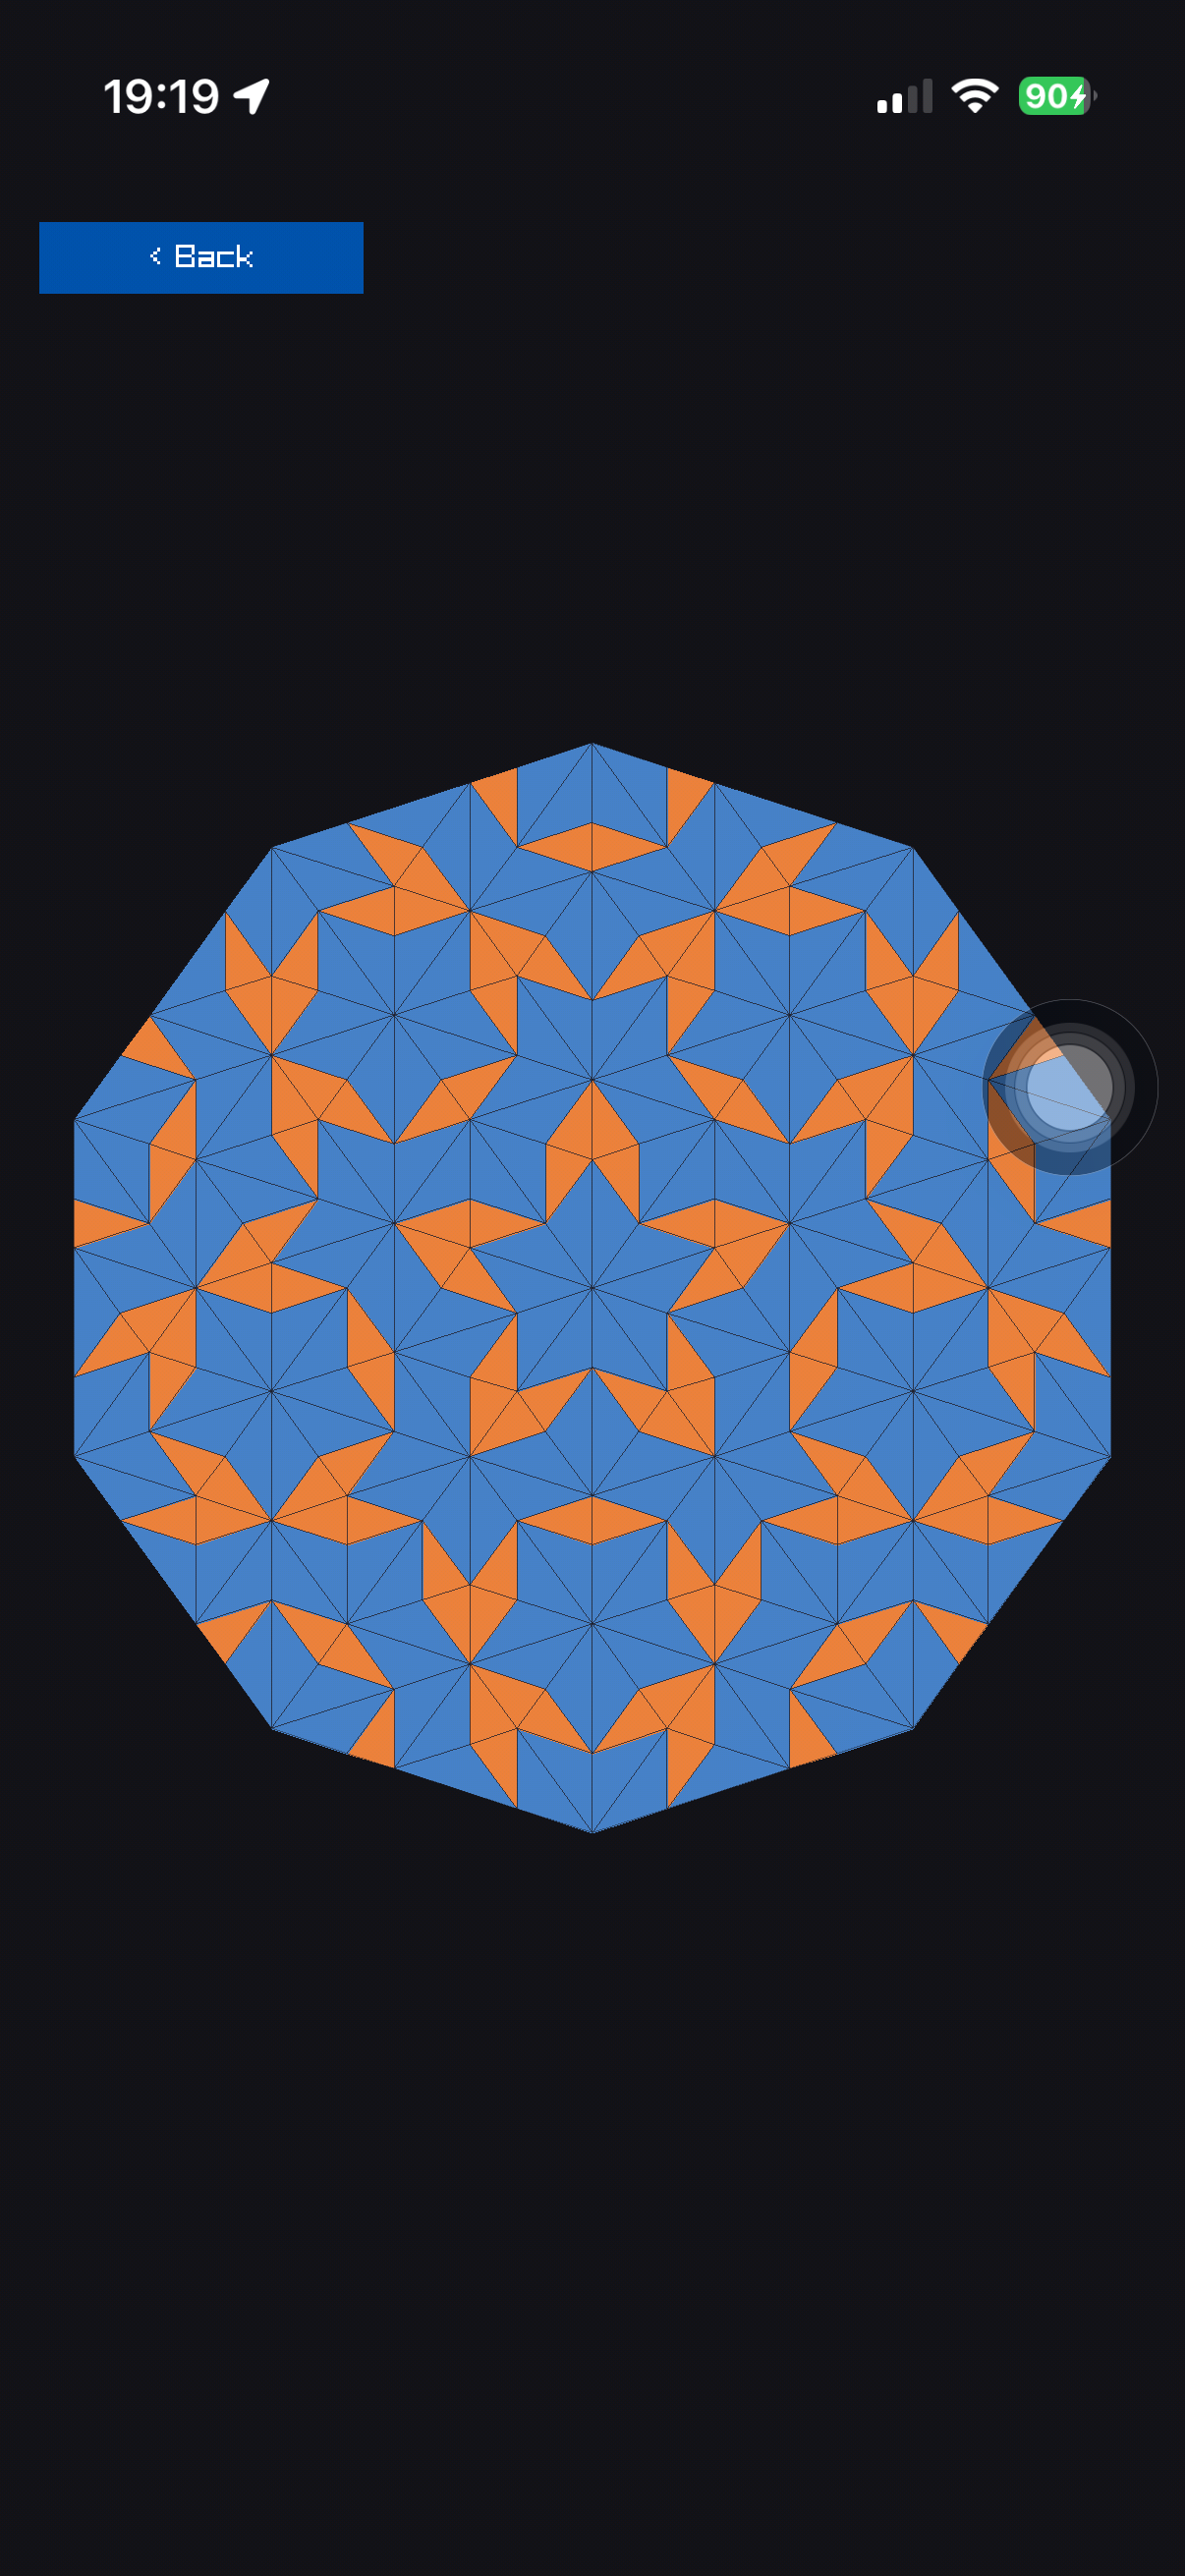
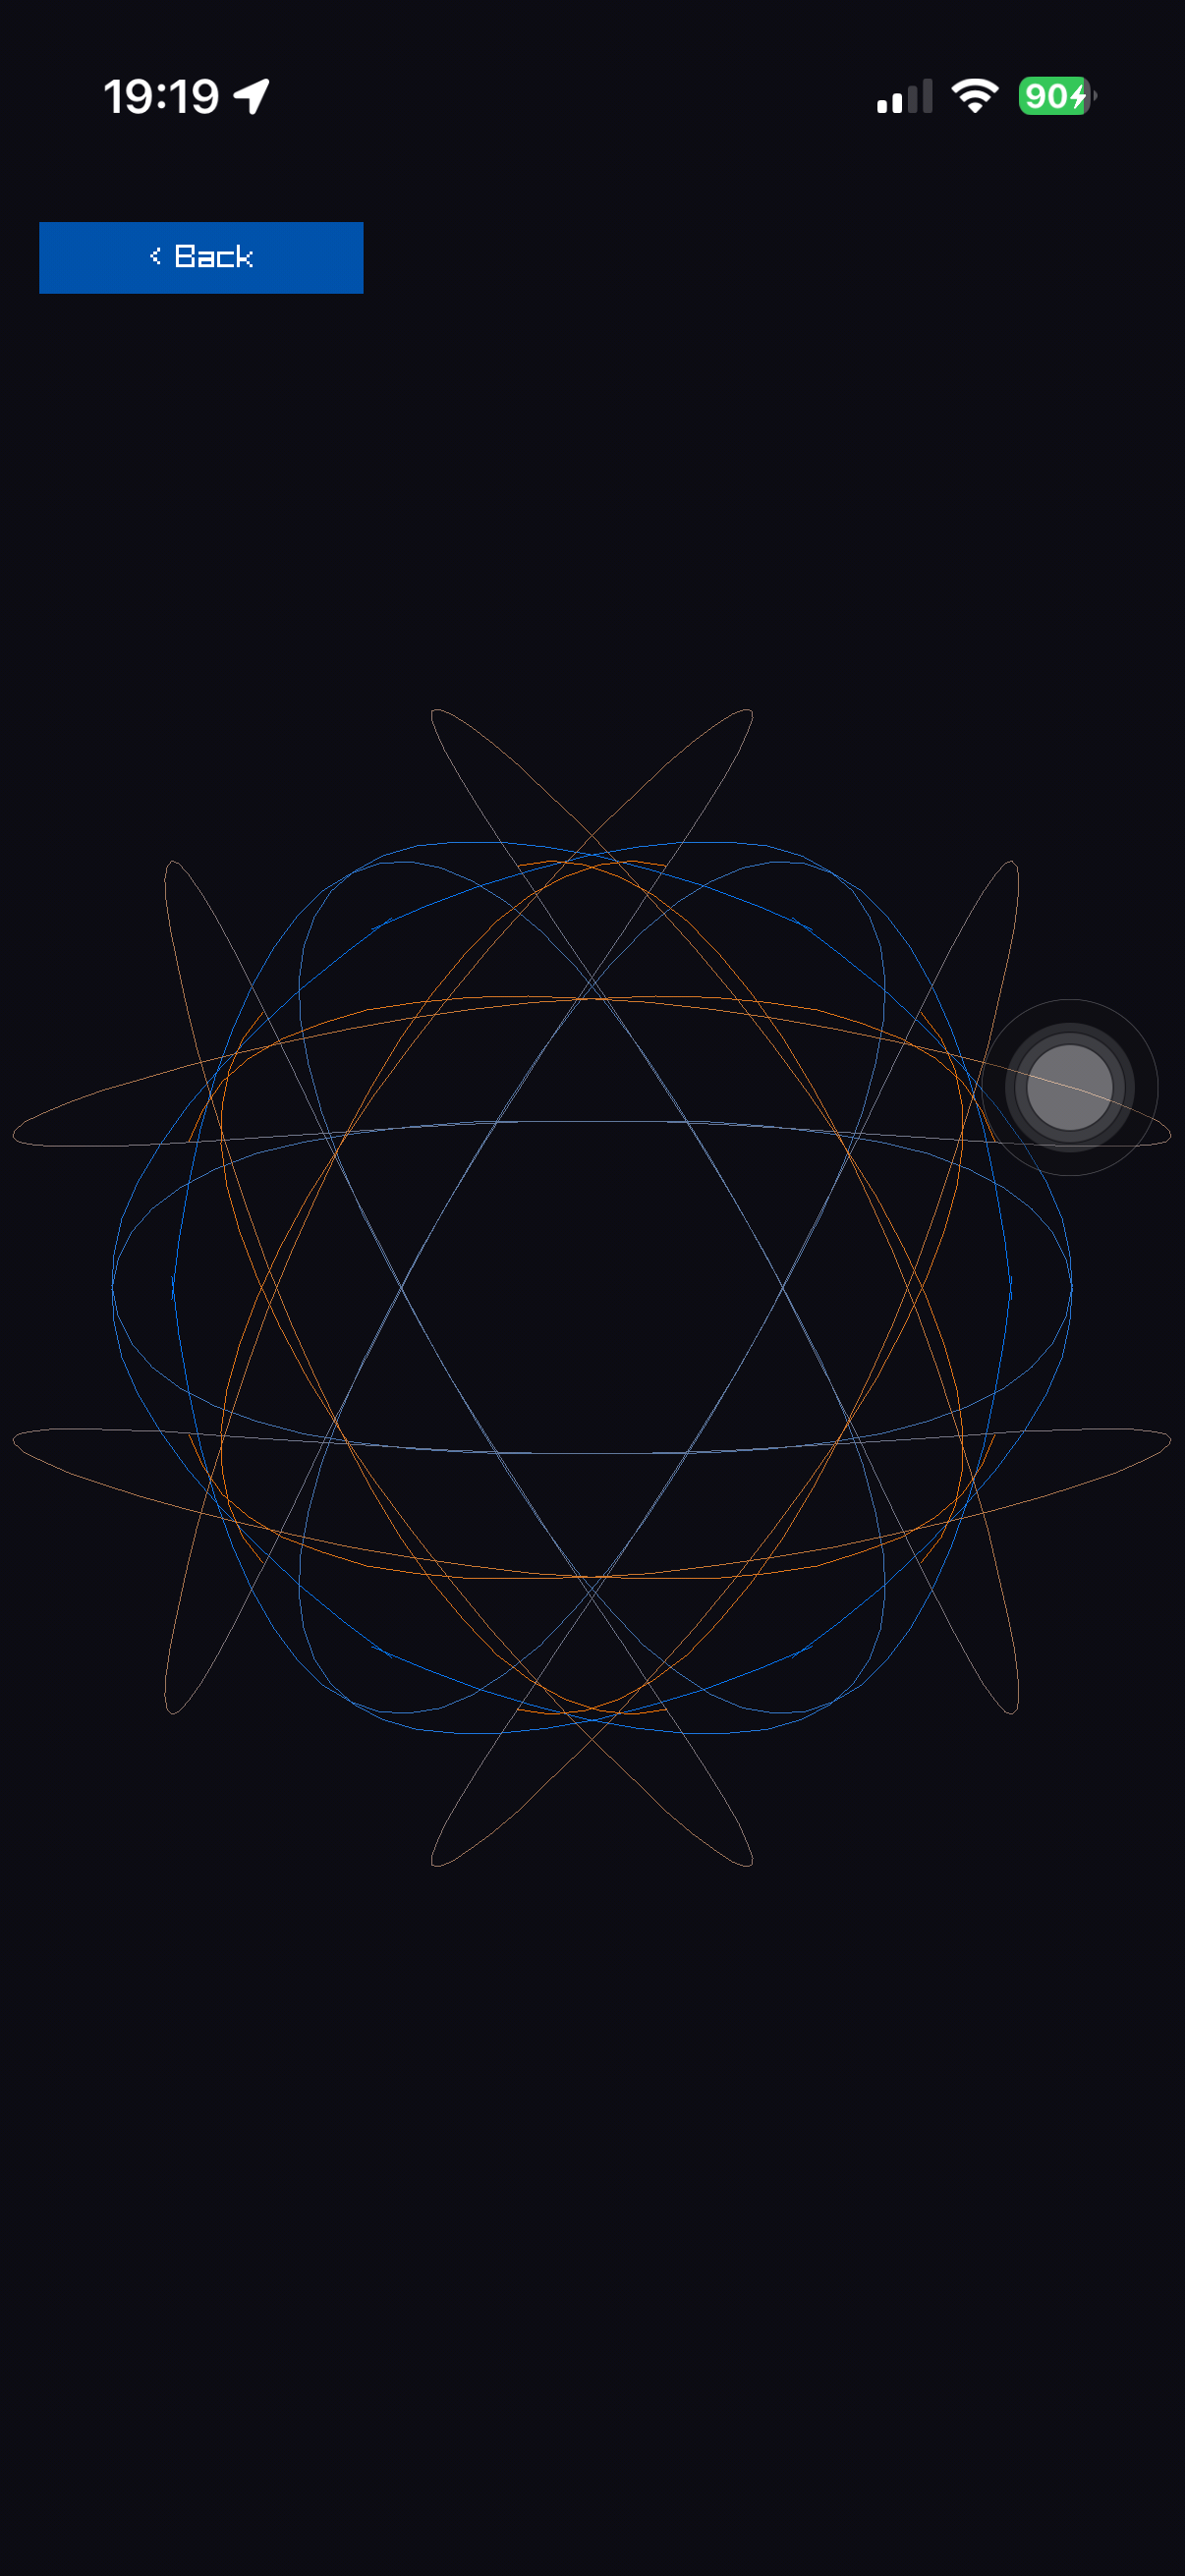
Left: penrose, 340 triangles and about 2400 FFI calls a frame, at 57 fps. It is the scene that disproved the draw-call theory. Right: kaleidoscope, 708 lines a frame at 58, after the allocation came out of its draw loop.
Where the budget lands
With the loops fixed, the remaining limit really is line count. Numbers to plan against, all at 59 fps unless stated:
| scene | per frame | fps |
|---|---|---|
| kaleidoscope, 60-point trail | 708 lines | 58 |
| spirograph, 1000 points | ~1000 lines | 55 |
| penrose, 4 deflations | 340 triangles, ~2400 calls | 57 |
| boids, 45 | 2025 distance tests, 90 draws | 52 |
| fireworks | ~120 circles | 58 |
| lorenz, 450-point trail | 450 lines, each re-projected | 58 |
| tesseract | 32 lines | 59 |
So roughly a thousand primitives a frame is comfortable, and the scenes that push past it carry a knob: trail-length, max-points, default-deflations, default-count. Each is a plain def, which matters for the next section.
A filled rectangle is cheaper than a line. That thousand came from scenes drawing lines and circles, and it turns out to understate what DrawRectangle will take. The cellular automaton draws 2551 of them a frame and holds 58 fps, which is two and a half times the figure above.
| scene | per frame | fps |
|---|---|---|
| life, 48x93 grid | 1470 rectangles | 59 |
| automata, rule 30 | 2551 rectangles | 58 |
Worth knowing before sizing a grid down to fit a budget it is not actually in. Both of those were tuned twice on the assumption that a thousand was the ceiling, and both had room.
When a thousand primitives is the wrong budget
Lorenz broke the rule above and it took a sweep to see why. It draws 450 lines, well inside the comfortable range, and it will not go much past that. The L-system draws 1488 and holds 59.
The difference is not how many lines get drawn, it is what happens per line before the draw. The L-system's segments are computed once at init and then handed to DrawLine unchanged every frame. Lorenz orbits its camera, so every point is rotated and perspective-divided on every frame, and the cost is that arithmetic rather than the drawing.
The first version made it worse by allocating: project returned a fresh [x y] vector per point and trail-colour a fresh [r g b] per segment, so a frame allocated about 2400 short-lived vectors. That ran at 18 fps. Rewriting the loop to carry the previous screen point in primitive loop bindings and inline both computations took it to 31, which is the same 1.7x the draw-loop rewrite bought earlier in this guide, for the same reason.
Then the sweep, at 450 through 1200 points, reading last-fps after letting raylib's 30-frame ring refill at each step:
| trail | 1200 | 1000 | 800 | 600 | 500 | 480 | 460 | 440 | 420 | 400 | 300 |
|---|---|---|---|---|---|---|---|---|---|---|---|
| fps | 25 | 23 | 29 | 32 | 56 | 59 | 59 | 58 | 58 | 59 | 59 |
Flat at vsync to 480, slipping at 500, and falling away steeply past 600. The default is 450, which sits inside the flat region with room for a phone that has warmed up.
Read the steep end with suspicion. The same 1200-point trail measured 31, then 20, then 24 to 28 across one session, a spread of about 30% on identical code. Once a scene is over budget the readings stop being repeatable, most likely thermal. The flat end is solid and the cliff edge is real, but treat any single number past the knee as indicative.
The rule the earlier sections give still holds, it just needs its terms stated properly. The budget is per-frame work, and primitive count is only a good proxy for it while the work per primitive is roughly constant. A scene that computes geometry once and redraws it gets the thousand. A scene that recomputes every vertex every frame gets a few hundred.
rlgl is the wrong tool when raylib already has the call
The clock of clocks draws 144 small bezels and 288 hands. Three drafts, and the numbers are worth keeping because two of them are counter-intuitive.
| draft | fps |
|---|---|
bezels as draw-ring, 20 segments each | 6 |
bezels as draw-circle-lines | 50 |
| plus the hands collected into a vector for one batched call | 47 |
| plus the vector removed, vertices emitted straight from the loop | 59 |
draw-ring is an rlgl helper this project added because raylib's own DrawRing takes its centre as a by-value Vector2. It emits 120 vertices for a 20-segment ring, so 144 bezels is about 17,000 FFI calls a frame. DrawCircleLines has no by-value argument, needs no helper, and draws the same circle in one call. rlgl earns its place where raylib has no call for the shape. Where raylib does, it is strictly worse.
The middle row is the one that surprised me. Drawing 288 hands through draw-line-ex opens and closes an rlgl batch per line, which is three extra calls each and 864 a frame. Collecting the segments into a vector and drawing them in one batch removes all 864, and it measured slower: 47 against 50. The batch had traded 864 FFI calls for 288 vector allocations, and on this runtime the allocation is dearer. That is the same lesson the flow field and the Lorenz attractor both taught earlier on this page, arriving from a direction that looked like an optimisation.
Keeping the batch and dropping the vector gets both: one rlBegin, one colour, one rlEnd, and every vertex computed and emitted inside the loop with nothing allocated between them. 59 fps.
Two more scenes hit the same wall the same night, which is what makes it a rule rather than an anecdote. The ring scene built two 97-point vectors per frame and partitioned them into pairs to stroke its outline: 40 fps, and 59 once the points were computed straight into the vertex stream. The spline scene was worse, because it did that three times over, once per basis: about a thousand allocations a frame and 20 fps, against 59 for the same picture with the previous point carried in a loop binding.
The shape of the fix is always the same. Keep the collection-returning function, because tests want something to inspect, and do not call it from the draw path. ring/arc-points and splines/curve both still exist and are both still tested. Neither runs sixty times a second.
Sizing a scene on the laptop
A port is sized before it reaches the phone, by timing it under jolt on the laptop: the update, the build of the draw list and the draw side's own loops, with the FFI calls stubbed out. The rule that came out of the 2026-10-03 device pass is a target of about 0.30 ms for that figure.
That number is empirical. It is not the 16.7 ms of a frame divided by the laptop-to-phone factor, because that arithmetic gives 0.50 ms and 0.50 ms did not hold 60 fps. The factor itself is about 33: the phone runs scene code about 33 times slower than jolt on the laptop. It was measured by timing wavecubes and pointcloud on both, and it is rough, since the two scenes spend their time differently. The 0.30 ms leaves about 6.8 ms of the frame for the host and the GPU.
These are the readings that pass produced. Each phone figure is from three idle readings:
| scene | laptop ms (bench) | phone fps |
|---|---|---|
| voxel, start view, before its fixes | 0.38 | 57 |
| voxel, corner, before its fixes | 0.56 | 32 |
| 3D split screen, start, before its speed-up | 0.527 | 40 to 41 |
| bouncing spheres (6 by 8 builds) | 0.39 | 60 |
| geometric shapes, cached steady state (draw stubbed) | 0.36 | 59 to 60 |
| fog of war | 0.30 | 59 to 60 |
| voxel after its fixes | 0.20 and 0.30 | 59 |
Read it in three bands. At about 0.30 ms and under, scenes held 59 to 60 fps. The edge, 0.36 to 0.39 ms, measured 57 to 60. From 0.5 ms up, scenes fell to 32 to 41. So 0.30 is the line to aim at, but it is not a cliff, and 0.45 ms, the figure earlier ports were sized against, is past the edge.
One caveat limits all of this. Each bench stubs a different share of the draw side. Geometric shapes' 0.36 ms is mostly a stubbed draw-3d! loop and it still held 59 to 60 fps, while voxel at 0.38 ms read 57. A laptop figure within about 20% of the line, so from 0.24 to 0.36 ms, is a reason to measure on the phone and not a verdict either way.
Texture uploads
A texture scene pays for its pixels in a place a shape scene never does: the loop that writes each texel into the buffer rlLoadTexture reads. Each figure below is marked measured (a reading on the phone) or derived (worked out from one).
The write loop is about 2.6 us a texel (derived). Sprite Animation memoises its grid, so its 197 ms reopen of 69120 texels is nearly all write loop: (197 - 17) ms over 69120 texels. It is an upper bound, because the 197 ms also holds rlLoadTexture. On the laptop the same loop is 0.071 us a texel (measured), which is why the cost only shows on the phone.
The pixel function adds to that. A scene that computes each texel pays 5 to 17 us more a texel on the phone for Srcrec Dstrec and Polygon Drawing (derived from their first-open pauses, so rough). Allocating a vector per texel is the part worth cutting. Polygon Drawing, three of Procedural Textures' panels and Raw Data pack with texel/pack4, which builds no vector; Sprite Animation, Textured Curve and Screen Buffer look a texel up in a grid or palette built once. Texture Tiling, Srcrec Dstrec, Sprite Button, Npatch Drawing and the noise panel of Procedural Textures still call texel/pack on a vector per texel.
First opens pause, reopens do not (all measured, largest single frame, with the median frame at 17 ms). The first open after launch holds a frame for about 1.0 s in Sprite Animation, 0.8 s in Polygon Drawing, 0.5 s in Procedural Textures, 0.2 s in Srcrec Dstrec and Sprite Button, and 0.17 s in Raw Data; the other four are under 70 ms. Once the filled staging buffer is retained, a reopen costs about one frame (17 to 18 ms) in eight of the ten. The exceptions are Procedural Textures (139 ms), whose noise is versioned and not retained, and Raw Data (149 ms), whose live panel is banded and not retained.
Two scenes cannot afford a whole rewrite per frame, so they refresh a band. Raw Data refills 3 rows of its 128 row live panel a frame, which is each row every 43 frames, about 1.4 times a second (derived from 60 / 43). Screen Buffer steps and uploads 8 rows a frame, and a sweep of 7 frames is one step of the fire, so it runs at about 8.6 steps a second (derived from 60 / 7) against the original's 60. Both show a moving seam between fresher and older rows, and both read 58 to 59 fps (measured).
Render targets are cheap to make. A target is zeroed on the CPU and uploaded, and a field-sized one is large: Mouse Painting's 9.3 MB canvas opens in 29 ms (measured, largest single frame). Top Down Lights opens in 75 ms, down from 119 ms when its targets also carried depth buffers (measured), and its ground texture, which packs a vector per texel, is probably part of what is left (estimate: 30 to 80 ms at the figures above). Sixteen field-sized lights, 17 targets and about 182 MB of colour (arithmetic), ran at 58 fps idle and while dragging a light (measured).
How these were measured
All of it live, over the nREPL, without a rebuild between readings. That is worth its own note because it changed how the work went.
net.b12n.raylib-ios.probe/fps-every-frame? turns on a per-frame GetFPS call and parks the answer in last-fps, so frame rate becomes a value to read rather than a console line to scrape. net.b12n.raylib-ios.gallery/tap! opens a scene without a finger. Together they let a single session open each scene in turn and read its cost.
Two traps, both of which produced wrong numbers before they were noticed.
Sample against the thing that varies. Spirograph's point count cycles from zero to its cap and resets, so a single fps reading catches an arbitrary phase. The first four readings were 18, 17, 27 and 15, all of the same code. Reading the point count alongside fps is what turned noise into a curve.
Build --dev or redefinition does not reach the loop. A release build inlines across call sites, so alter-var-root updates what the REPL sees while the running loop keeps calling the original. Every tuning number above came from a DEV_BUILD=1 build, where a redefined trail-length takes effect on the next frame. The cost is negligible: --dev held mean 17.05 ms against release's 17.02.